JW Player
Analytics Dashboard – 2017
As part of a larger refactor of our customer portal, our outdated analytics overview page needed to be rebuilt. It gave the design team an opportunity to refresh the look of the page with updated branding, and change the look of the charts and graphs we were using to represent customer data.
Overview Page
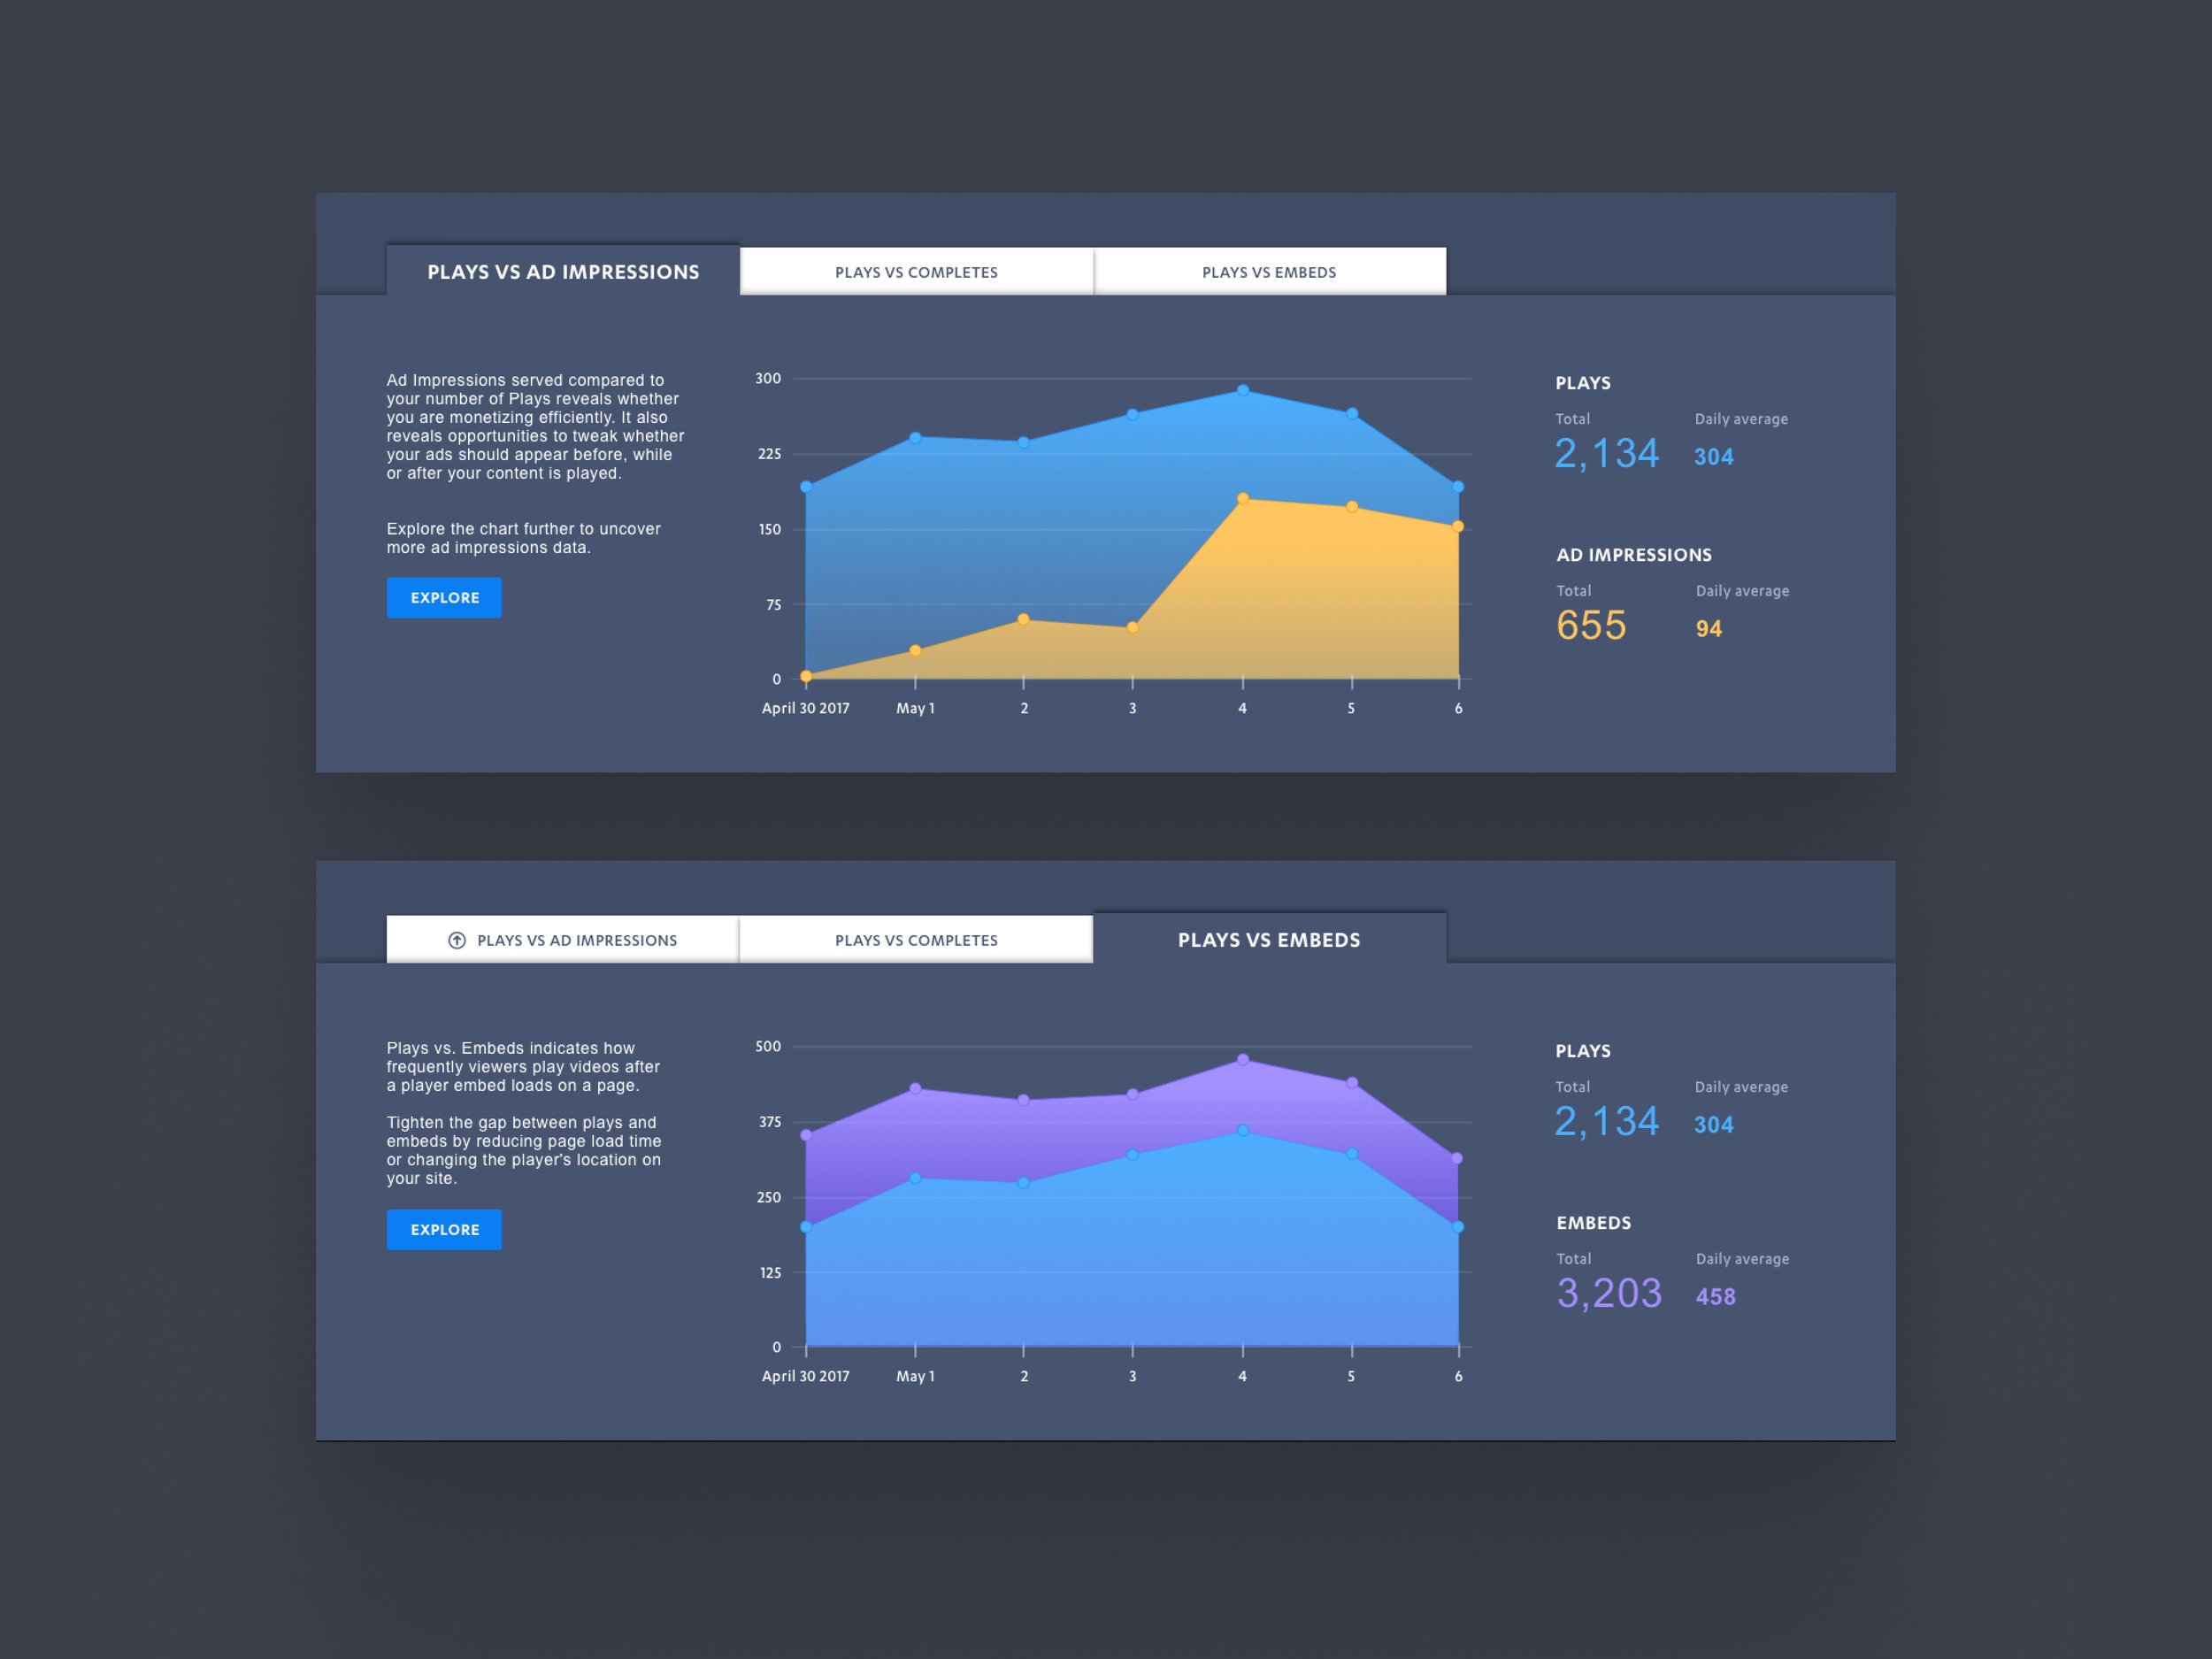
We gave our users two hero charts with basic data, plays vs completes and plays vs embeds. For customers of our ads product, plays vs impressions was also available.
We also displayed plays per viewer, Time watched per viewer, ad fill rate, top countries, plays by device, and top domains.
Zero data and error states
Since these charts were new to the design system, I specified zero states.
Future iteration and research
Refactoring this page was a quick win that let us incorporate some design improvements and set us up for future iterations with a new design system.
It also created an opportunity for the team to examine the overall product strategy for the analytics product suite. These conversations laid the groundwork for future efforts to integrate analytics into the content management portions of the platform, and more generally socialize the need to prioritize this work.


